
Grace Sweeney
Contributor
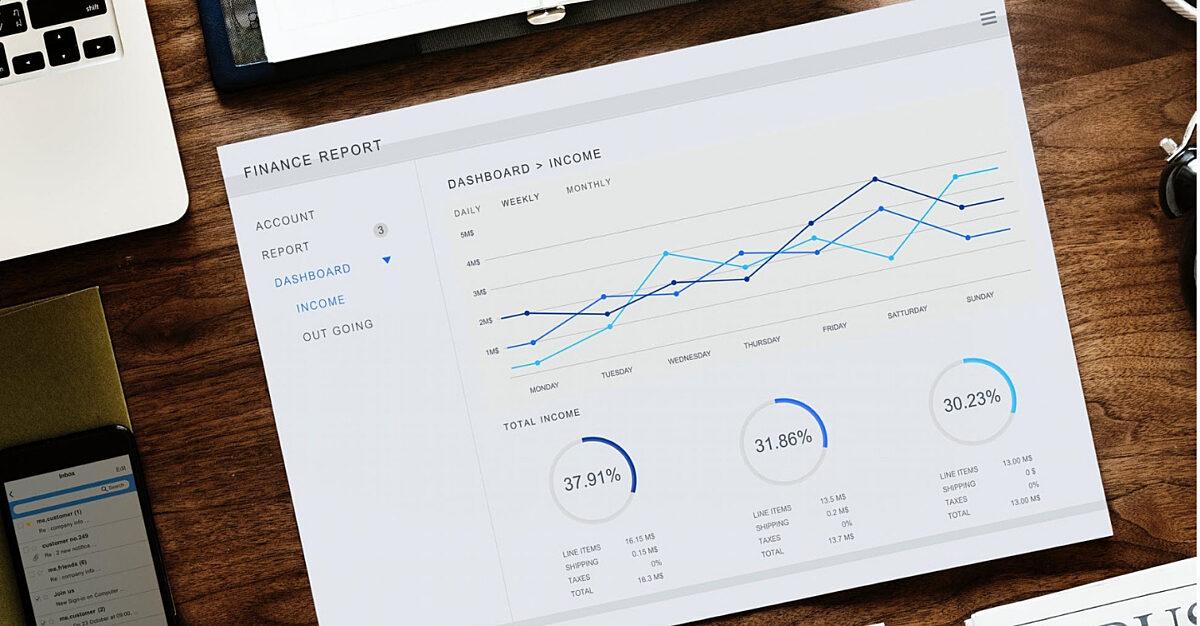
Today’s sales managers have tons of data at their fingertips; from sales velocity and pipeline coverage to CAC, CLV, and so many reports. But with insights coming from all angles it can be hard to separate the vanity KPIs from the sales metrics that really matter.
So, what exactly are sales metrics?
The most basic definition of a sales metric is: a data point that represents performance. These data points can be evaluated on an individual, team, or organization-wide level.
Effective sales managers use metrics to track progress, forecast profitability, and spot problems before they spiral out of control.
To help you identify which metrics you should be paying attention to, here are some of the most critical sales metrics you and your team should be tracking.
1. Lead response time
Every minute matters in sales. Lead response time is a powerful predictive tool when it comes to conversions and closed deals. You see, statistics favor first responders.
Lead response time is defined as the time between the initial inquiry and the rep’s response.
According to the Harvard Business Review, the average lead response time is 42 hours.
Of the businesses they surveyed, the 37% that responded within an hour were seven times more likely to qualify a lead than those who took their time.
To monitor this metric, use your CRM to track how long it takes reps to qualify a lead. If reps are slow to respond to new inquiries, you might need to shift your strategy or hire more reps to improve response time.
While you'll generally measure response time after the initial call or email, you can also look at response times at any other point in the sales cycle. Look at things like follow-up times after downloading an ebook or booking a demo.
2. Closing ratio
Closing ratios or win rates represent the percentage of deals closed compared to how many opportunities reps went after. So, if you make 100 pitches and 25 sign the contract, your win rate is 25%. Pretty simple, right?
Understanding your team’s win rate requires you to first understand how they spend their time. Then you can drill down into the behaviors that make or break a sale.
Pro-tip: Download the win/loss analysis checklist to get insights beyond just the win rate number.
Historical closing data can help you understand how your reps are performing. If your close rate drops or falls flat suddenly, something might be wrong with your team’s approach, quality of leads, or your strategy.
Conversely, when win rates are on the rise, it’s a sure sign your reps are improving. As a sales leader, you should always seek to improve your team’s collective win rate.
Use your CRM to look at where losses are coming from. In Copper, the Loss Reasons report provides a breakdown that comes in handy when it comes time to adjust your strategy. Why are you losing so many deals to competitors? Is it price-related? Something to do with product features? Or, maybe reps are failing to highlight your brand’s unique value proposition.
Or, review Sales by Source. Here you can review how closing ratios differ by source. Do leads from a certain source move through the pipeline faster? Is there one source that brings in a disproportionate amount of unqualified leads?
3. Revenue
Revenue may well be your most important metric. It’s how reps get paid and the lights stay on. While the concept seems simple at first blush, you’ll need to do some digging through the data to establish a clear picture of your revenue stream.
See, revenue represents how much money you’ve received within a specific time frame. That includes discounts and returns, too.
Subscription businesses, for example, typically calculate revenue as monthly recurring revenue or MRR, which represents the amount of predictable revenue expected on a monthly basis.
You’ll want to break down your revenue to understand the following:
- What percentage of revenue comes from new business?
- What percentage of revenue is represented by upgrades, cross-sales, or add-ons?
- What percentage of customers renew service each month?
- How often do reps follow up with existing customers?
4. Customer acquisition cost (CAC)
Customer acquisition cost or CAC is a metric that can reveal whether or not your company is healthy.
CAC represents the total cost of acquiring a new customer. This includes everything involved with the sales and marketing process over a specific time frame, including salaries, discounts, campaign costs, and other expenses.
You can measure CAC by dividing all these costs by the number of customers you acquired. If you spend $1,000 on marketing and get 100 customers, the CAC is $10. Whether that number is good or bad depends on how much the average customer spends. If it costs $10 to attract one new customer, but they spend $75 on average every time they order, then you’re in good shape.
On the flip side, if you pay $10 per customer and they only spend $5 on their next order and ultimately stop buying, not so good. Your business model needs to change if CAC exceeds your ability to monetize those new customers.
Sales managers should look at:
- Cost spent per lead
- Conversion rates at each pipeline stage
- How many touchpoints required per closed deal
5. Customer lifetime value (CLV)
Customer lifetime value (CLV) is the complement to CAC. In order for the business to grow, your CLV must be higher than CAC.
The purpose of calculating CLV is to determine whether you’re spending resources efficiently on marketing and sales.
Customer lifetime value or (CLV) is the total amount of money that the customer provides to your business over their entire relationship. This metric is important, as it’s much more cost-effective to keep existing customers than spend all of your energy chasing new ones.
To calculate CLV, multiple the average purchase value per year by the average customer lifespan in years. For example, if your average CLV is $500 and your CAC is $550, you’re losing money. So, identifying CLV is a critical first step toward developing cost-effective lead gen methods and new ways to increase the value of returning customers.
Some companies don’t even try to measure CLV. It’s too difficult to track how much a customer spends, along with how much it costs to serve them, market to them, and more. Part of the problem here is a lack of transparency in record-keeping.
When data comes from many different channels, calculating CLV becomes a real challenge. So, smart sales teams tend to centralize their information in a CRM.
On the Copper dashboard, sales managers can review historical data to learn whether some reps are spending too much time on a specific stage:
6. Sales pipeline coverage (SPC)
SPC allows you to review the opportunities that currently occupy your pipeline through a predictive lens. This metric represents sum of the revenue for all deals currently in process Calculating pipeline coverage is relatively straightforward. You’ll simply divide the number of deals needed to hit our sales goal by our average win rate.
What this sales metric does is help you calculate how many deals need to be in progress in order for you to hit your revenue targets.
The basic calculation is: Coverage = Pipeline/Goal
So, if you’re tracking a 60-day period, what is your expected win rate? Let’s say your close rate is 25 percent. So to hit that goal, your coverage needs to be 4x or better in order to hit goal.
Now, to calculate your coverage, simply divide your Pipeline amount by your Goal amount for the period. For example, if you have $4M in the pipeline and the sales goal is $1M, then you have 4x coverage. Meaning given that 25% percent win rate, deals in progress should total four times as much as the final goal.
Note that the SPC calculation only works if you have accurate data at your disposal. In Copper, you can review pipeline coverage by rep:
Here, you’ll see a breakdown of wins, losses, and open opportunities. The benefit is that you’ll have visibility and can allocate leads based on who is more likely to close.
7. Sales funnel leakage
Measuring funnel leakage will tell you exactly where prospects drop out of the funnel most often.
Determine where the holes are by tracking conversion rates at every stage. You can do this in Google Analytics: Conversions > Goals > Funnel Visualization.
The image below gives you a breakdown, revealing where people are dropping out at each phase. So, of those 10,214 people who viewed their shopping cart, 1,244 left without making a purchase.
Finding the “why” behind the leak is easier said than done, though. Sales and Marketing need to work together and scan for potential red flags such as:
- Opportunities to closed deals ratio is low
- Leads to closed deals is low
- The number of stalled opportunities is high
- Several leads have never received a follow-up
If you’re running into these warning signs, there are a few things you can do here.
Look at why prospects are disqualified—as you look at leads, try to understand why some aren’t a fit. Is your messaging off? Is it your price point or an issue with the onboarding process?
Track the touchpoints from initial contact to conversion—In general, the optimal number of touches per lead should be about 8-12 times. This spans the course of a few weeks and should consist of a mix of emails, calls, and social media.
Review the hand-off between stages—Look at how long an opportunity remains in each stage and why some don’t move forward. Reps need to learn how to set actionable goals that propel the prospect from one stage to the next. As you look at each stage, you’ll start to understand why deals stall and what you can do about it.
As you can see in the above graphic, there might also be an issue with Sales and Marketing alignment. Marketing could be passing off leads too quickly, so reps end up chasing deals unlikely to result in a sale. This might lead to warm leads falling out of the funnel. (Learn more about sales funnel management here.)
In this case, Marketing and Sales have to get on the same page about how leads are being handled.
8. Average sales cycle length
The length of your sales cycle is one of the most important sales metrics you can measure. The sales cycle represents a series of phases needed to sell your product or service and tracks a prospect as they move from lead to customer. The shorter the sales cycle length, the faster you’re earning money.
Use this metric to review the strength of your sales strategy and identify trends. Here are a few questions that can reveal why things are slowing down:
- Where are leads coming from? Some lead sources are better than others; referrals are more effective than lead lists.
- What methods are you using to qualify leads? Are reps applying the BANT method or something similar to incoming leads or just letting anyone through?
- What strategies are reps using by stage? There may be poor execution happening in one stage. For example, maybe the messaging is wrong for a particular stage. Or, the rep isn’t asking the questions that help prospects overcome objections.
If a rep has a shorter-than-average sales cycle, it’s worth looking at what’s working well for that rep and incorporating those best practices into the overall strategy. Reps struggling to move prospects through the cycle might benefit from some additional training.
The right data can make or break your team’s success.
The above sales metrics are only a small part of all the data that you have at your disposal. Looking at revenue or customer lifetime value might show how successful your company is, but you’ll need to dive deeper if you want to truly understand the “why” behind your success or shortcomings.